Ultimate ATR Extreme DetectorUltimate ATR Extreme Detector
Professional Volatility Analysis Tool for Strategic Trading
Discover Market Turning Points with Precision
Key Features
Smart Extremum Detection: Identifies when ATR reaches its highest or lowest point in your specified lookback period
Quad Visual Alert System:
▲ Green bottom triangles for low volatility signals
▼ Red top triangles for high volatility signals
Background color highlighting for instant state recognition
Status panel showing current volatility extremes
Dual Alert Modes:
TradingView native alerts ("ATR Low/High Signal")
Visual chart alerts with period details (e.g., "Alert: ATR Low (50 bars)")
4 Calculation Methods: RMA (Wilder's), SMA, EMA, and WMA
Fully Customizable:
Adjustable ATR period (default: 14)
Variable lookback window (default: 50)
Toggle features on/off via intuitive input settings
How It Works
The indicator scans volatility extremes using proprietary logic:
Calculates True Range using selected method (RMA/SMA/EMA/WMA)
Compares current ATR value against historical data
Flags critical moments when:
Volatility contracts to N-period lows (prepare for breakouts)
Volatility expands to N-period highs (watch for trend exhaustion)
Strategic Applications
markdown
复制
| SIGNAL | MARKET CONDITION | TRADING IMPLICATION |
|------------------|-----------------------|--------------------------------|
| Low Volatility | Contraction/Consolidation | Anticipate breakout moves |
| High Volatility | Expansion/Climax | Prepare for reversals or pauses |
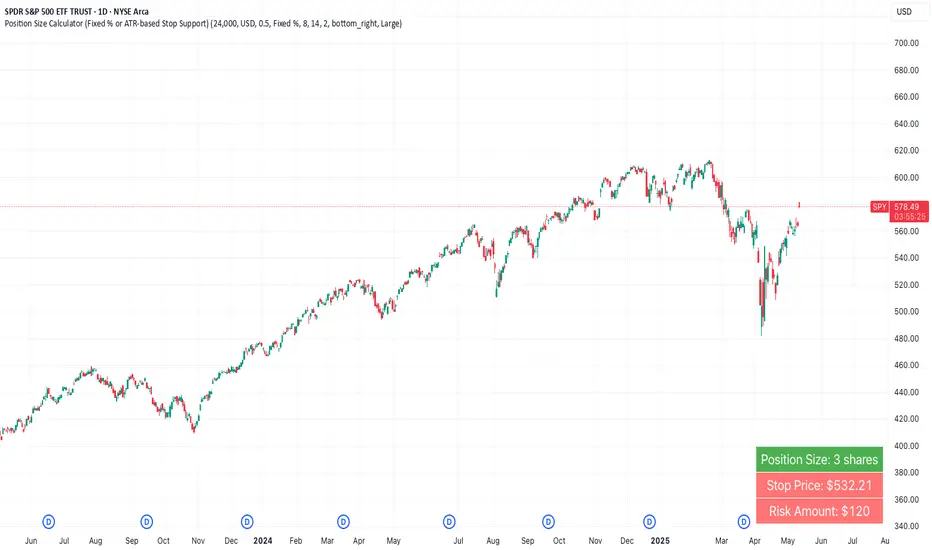
Position Sizing: Use ATR values to determine optimal stop distances
Entry Timing: Combine with price action at key support/resistance
Risk Management: Adjust stops dynamically based on volatility regime
Optimization Guide
Day Trading: Short lookback (20-30 periods)
Swing Trading: Medium lookback (50-100 periods)
Position Trading: Long lookback (100-200 periods)
Volatility Analysis: Compare multiple timeframes simultaneously
Professional Setup Recommendations
Combine with:
Breakout Confirmation: Volume spikes, chart patterns
Reversal Signals: RSI divergence, candlestick reversals
Volatility Filters: Bollinger Band contraction, Keltner Channel breakout
Compatibility: Works flawlessly across FX, stocks, crypto, and commodities on all timeframes.
Why Traders Choose This Indicator
"Transforms complex volatility analysis into clear, actionable visual cues – the essential tool for breakout traders and risk managers alike."
Install Now to:
Spot consolidation before big moves
Identify exhaustion at trend extremes
Automate volatility-based position sizing
Receive instant alerts at critical volatility turns
Master market rhythms with professional-grade volatility intelligence!
Pine Script®指标